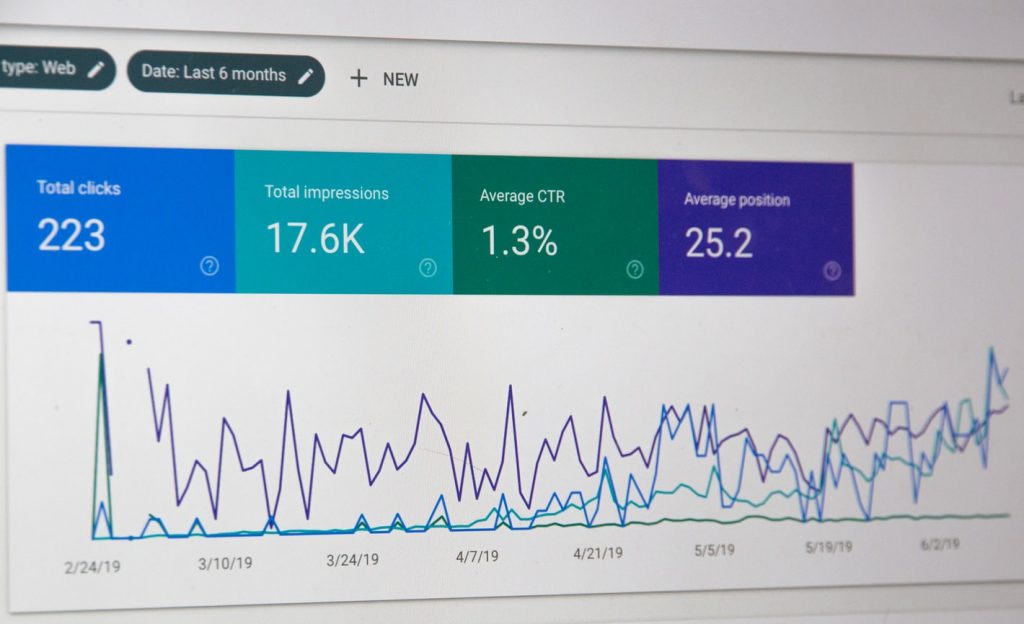
For my presentation, I have decided to focus on data visualization. For those interested in web design and SEO, I will very briefly talk about projects we can work on; however, for the sake of you having time to “play” in class, let’s get into data viz!
Here are the topics we’ll cover:
Clean data
What does it mean to clean data? How do you do it?
Open data sets to peruse:
https://www.kaggle.com/datasets
https://public.tableau.com/en-us/s/resources
https://www.google.com/publicdata/directory
Data Visualization
What is data visualization? How does it align with humanities research?
Data viz tools that are free/open source:
https://gionkunz.github.io/chartist-js/examples.html
https://public.tableau.com/en-us/s/
http://timeline.knightlab.com/#examples
https://infogram.com/examples/charts
https://datastudio.google.com/navigation/reporting
And a bit of inspiration…
https://informationisbeautiful.net/visualizations/worlds-biggest-data-breaches-hacks/
http://beta.wind-and-words.com
Demonstration
I’m going to start by showing you how to use Tableau Public, a free data visualization tool. We’ll use a well-known open data set, the Titanic passenger list. (Click here and click on “sample” data. Scroll down to the “lifestyle” section.)
After you learn a bit, you’ll be free to explore and play with your own data visualizations!
Check out my profile to learn more about my availability and what kinds of projects I can help students with.
